Grapher Goes International!
Grapher promises me correct characters in my language. It is important for me. It is well done. Janusz Kazmierski, IBW PAN, Poland
Grapher now supports international fonts and characters. Use any language, such as Chinese, Russian, Greek, Hebrew, or Arabic. All aspects of your Grapher plot support international characters. For example, you can set your drawn text, plot labels, axes labels, graph titles, and more to any language. Customize your graph with language that your audience will understand.
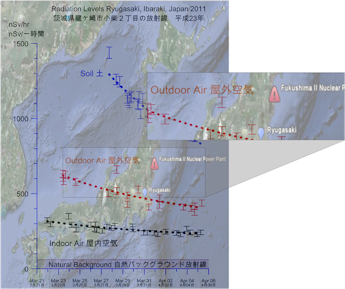
Both Japanese and English are displayed as text to effectively communicate the details of the radiation levels following the 2011 tsunami.
Image courtesy of Stephen Ross.
The 64 bit version succeeded in loading the 55 million rowsKim Frankcombe, Explore, Australia
Work with all of your large data sets and images without the worry of running out of memory!
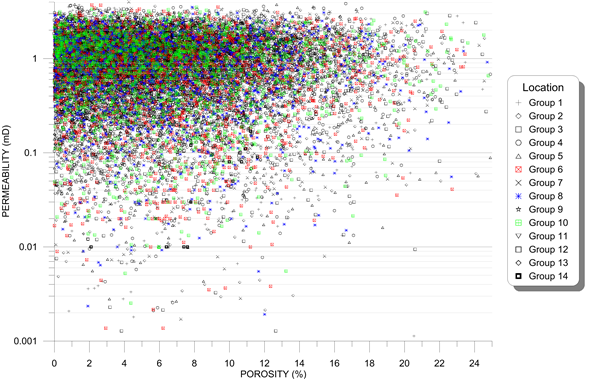
This graph creates a classed scatter plot from more than 1 million data points quickly.
I think besides 64 bit support this is the best new feature. Now it is really easy to make cleaner axis labeling if desired and moving tick labels and axis-title labels works like a charm... Kurt Trinko, Austria
Quickly and easily remove overlapping labels! Grapher has long allowed you to click and drag plot labels. Now, you can click and drag axis labels, axis titles, or graph titles to new locations using the Move Labels command. Simply click on the object, select the command, and drag labels to anywhere you need.
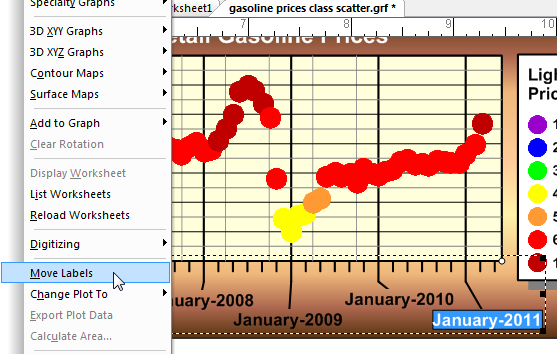
Click the Move Labels command to click and drag labels to any location on the graph.
Lines connect the axis location to the moved label.
Grapher is a fabulous tool for creating presentation-quality software. It is almost infinitely flexible and is not constrained by some of the limitations that hamper my use of other graphing programs. David Suder, Precise Environmental Consulting, USA
Import and export in all popular formats! New import formats include Access 2007 ACCDB file format. In addition, import your database information from tables or from queries.
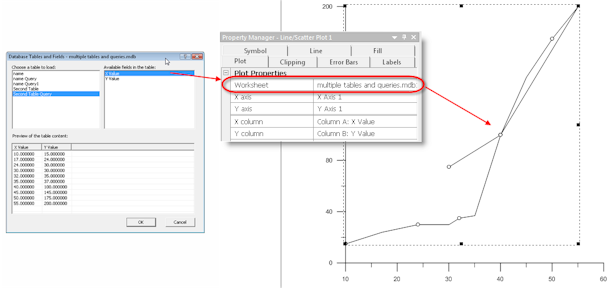
Create any graph directly from your query in your Access database.
I value every data point I use and think it deserves a decent frame. While allowing a user to produce a variety of plots in a quick and effective manner, Grapher also offers a full control over every smallest detail of these plots. Igor Yashayaev, Bedford Institute of Oceanography, Canada
Line/scatter plots and bar charts can be clipped using the options on the Clipping tab. Draw line/scatter or bar charts to the clipping value or remove values outside the plot range.
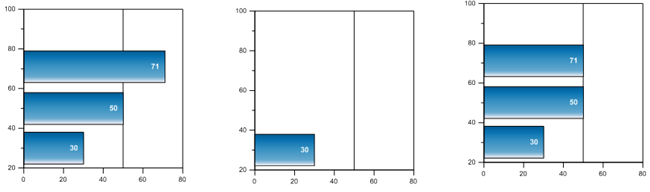
The same data displayed without clipping, with clipped bars
removed, and with clipped bars drawn to the clipping limit.
Fit Curves and Confidence Plot Clipping
This is a very useful feature. Jakob Schwander, University of Bern, Switzerland
Fit curves and confidence intervals can be clipped using the options on the Clipping tab.
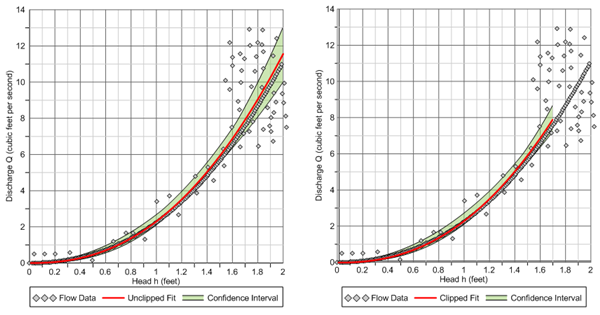
Use clipping, as in the plot on the right, to confine fit curves
and confidence intervals only to certain areas on the graph.
In any case I am now "hooked" on Grapher 9! Stephen Ross, Infrared Free Electon Laser Research Center, Japan
Label any portion of any plot. Grapher 9 adds the ability to display labels for all aspects of your box-whisker plot.
Label floating bar charts with data values or from a worksheet column.
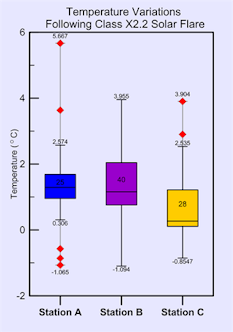
Emphasize all important aspects of
your data with labels, symbols,
colors, and text.
I think that the product is moving in the right direction with each version there are improvements. David Orr, Fisheries and Oceans Canada, Canada
Format all labels on your date/time axes with date/time labels. Specify different formats for your major and minor tick marks. Set label format, tick mark divisions, and other tick mark and label formats with date/time information for both major and minor tick marks.
Display minor tick labels at any desired
date/time interval you prefer. This graph
shows monthly major labels and weekly minor date labels.
Report quality graphs it does very well. Anthony Miller, RPS Energy, United Kingdom
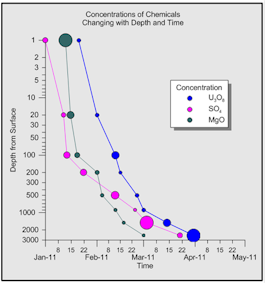
Change the text for each item in the class scatter plot legend to make your graph easier to understand. Include the range of values in the class, the class name or explanatory text, or link text from a worksheet to the legend.
Change the symbol size displayed in a class scatter plot legend. Create multiple columns and rows to most accurately display your class scatter plot.
Improved Axis Worksheet Labels
It really is the most flexible package out there. I tell people if you can visualize a plot, you can make it with Grapher. Eric Tappa, University of South Carolina, USA
Limit tick marks worksheet labels to specific worksheet rows.
Edit Individual Objects in a Combined Object
The ability to edit and change those elements without having to break apart the elements is a GREAT feature. Sharon Van Dyke, Surtek Inc., USA
Change all properties of items that are combined without ungrouping the combined object.
The complete Grapher package includes:
- Free Online Training Videos
- Grapher Quick Start Guide
- Free Technical Support
- Available Full User's Guide (Optional)
- Grapher CD, or downloaded installation file