Automatically create true, full-color customizable cross sections! Cross sections can be created from your lithology or interval data by simply connecting boreholes in a map view and pressing a button. Subsurface visualization has never been this easy.
There are many options when displaying cross sections, such as hanging the boreholes on various reference datums (i.e. mean sea level or a marker bed), spacing the wells proportionally or uniformly, exporting the cross section to Voxler for 3D viewing, exporting the data to an XYZ data file (with top and bottom data, useful for use in Voxler and Surfer), specifying vertical exaggeration, and selecting which layers you want the cross section to show. All the layers can be fully and easily reshaped to create just the look you want.
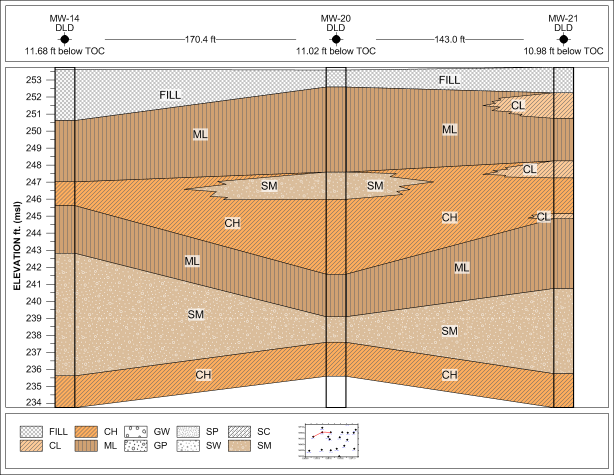
Create detailed and customized cross sections.
Maps
Strater can create a map of your area, showing borehole locations and base map files. You can create a well location map, which posts a symbol at each borehole location. You can label the symbols, change the symbol properties of the individual boreholes, and add base maps (i.e. georeferenced imagery, DXF and SHP files). Connect the boreholes in the map to automatically create a cross section. You can also create a base map without the borehole locations, adding as many base map files as needed.
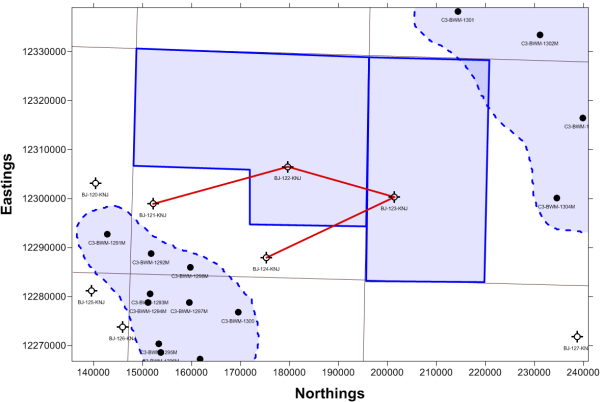
Display borehole locations and base maps in map view. Connect boreholes to automatically create a cross section.
True Vertical Depth Conversion
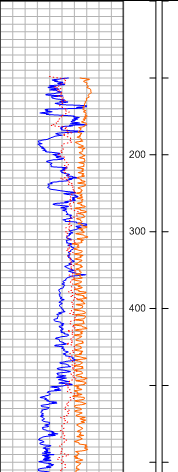
Strater allows you the flexibility of displaying your data in measured depth or true vertical depth! Strater uses inclination and azimuth data and performs the conversion for you. Choose between five different calculation methods to perform the measured depth to true vertical depth conversion. Depth logs can be individually set to show measured depth or true vertical depth independent of the borehole display, allowing you to create one depth log showing measured depth and another showing true vertical depth side-by-side.
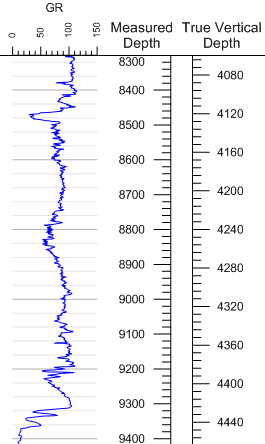
Display your logs in either measured depth or true vertical depth!
Strater does the calculation for you.
Tadpole Logs
Tadpole (or dipmeter) logs display data using a tadpole style arrow symbol. The head of the tadpole is plotted at depth against dip (0 to 90°), and the tadpole vector line is rotated around by the dip direction (0 to 360°). You can also include a fourth data variable for the type or structure class of the measurement (a keyword) and specify drawing properties for the symbol based on the keyword.
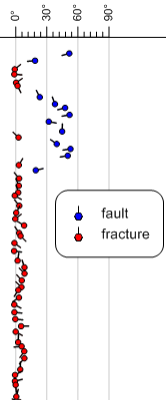
Display dip and dip direction for different measurement types using a tadpole log.
Function Logs
You can create a new log based on a function expression. The function expression can be purely mathematical in form, or the function can be based on data or depth variables used in existing logs in the view. For example, you can calculate the product of two curves and display the result as a new curve. The results of the function expression are saved to a new data table, and the function expression is saved for future reference.
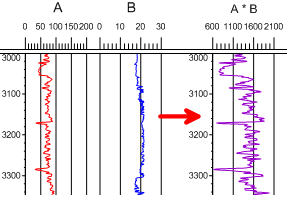
Perform calculations using data from existing logs with the new function log.
Depth Log Enhancements
Create depth logs the way you want them! Set the label frequency to 0 to show no labels, and set the starting and ending tick labels independently from the tick marks. You even have the option to display the log in measured depth or true vertical depth.
Create depth logs and label only the ticks you want labeled!
Scheme Editor Enhancements
The Scheme Editor has been redesigned to make it easier for you to organize and edit your scheme items. Reorder your scheme items by simply dragging and dropping them in the list, or sort them in ascending or descending order. You can copy scheme items from within a scheme, and even resize the Scheme Editor to make viewing easier!
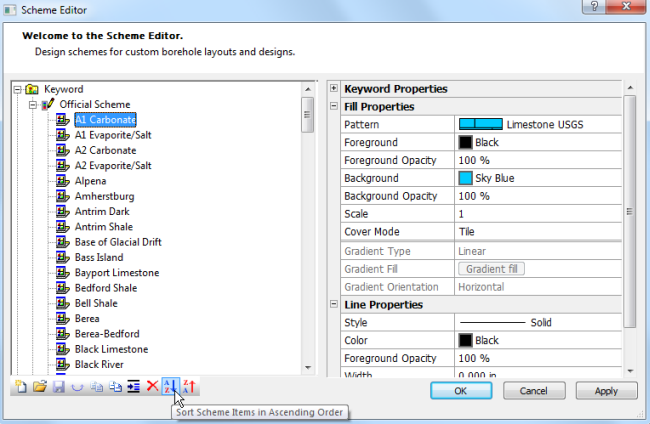
Sort all items in a scheme in ascending or descending order with a simple click!
Linked text is even easier to use to display the information you need. Use the new suffix/prefix options to add descriptions before or after the linked text. Or, use the “Current Page Of Total Pages” option to show the page designation. You can combine the two and have a single text object, such as “Page 1 of 7”, that updates with the page you are on.
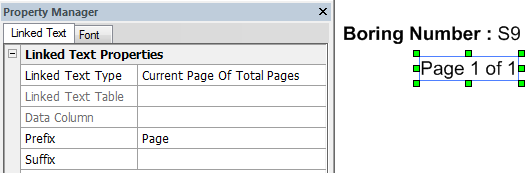
The above right shows only two linked text objects. In the first linked text object, Math Text
instructions were used in the prefix to make “Boring Number:” bold. In the 2nd linked text object, the prefix "Page" was added to show the current page of total pages.
You’ve waited long enough. All aspects of Strater now support international fonts and characters such as Chinese, Cyrillic, Arabic, Russian, Azerbaijani, Hungarian, and Hebrew text.
Harness the power of 64-bit Windows! Work with all of your large data sets and large imagery without the worry of running out of memory.
The data tables include two new features. You can convert measured depths in a data file to true vertical depth by simply specifying the inclination and azimuth sources and selecting a calculation method for the conversion. You can also create an XYZ data file in true vertical depth for all points in your data table.
Strater 3 includes three new export options, sure to make your life easier:
1. Export Multiple Logs: export all logs using the current borehole view with a single click. This is particularly useful to export all logs to a single PDF file, or to export all logs to individual image files for inclusion in reports.
2. Export to multi-page PDF: export all pages of your log to a single PDF file. If you export multiple logs to a PDF file, then all pages for all logs are exported to a single PDF file!
3. Export to LAS: export all selected curves to an LAS file.
- Drag/drop items seamlessly between panes.
- Copy the entire view (all panes) at once to paste into another program, such as Microsoft PowerPoint or Word.
- Use the new "always on" position/size toolbar to position and resize your objects. The object positioning is no longer buried in the Property Manager.
- Save the order of the tabs to the SDG file! Once you have your project organized just the way you want it, Strater will keep the tab order for you.
- Right click a view or data table tab to delete or close that view or table.
- Click File | Load Data from any view! No longer is this command accessible only in the data tables.