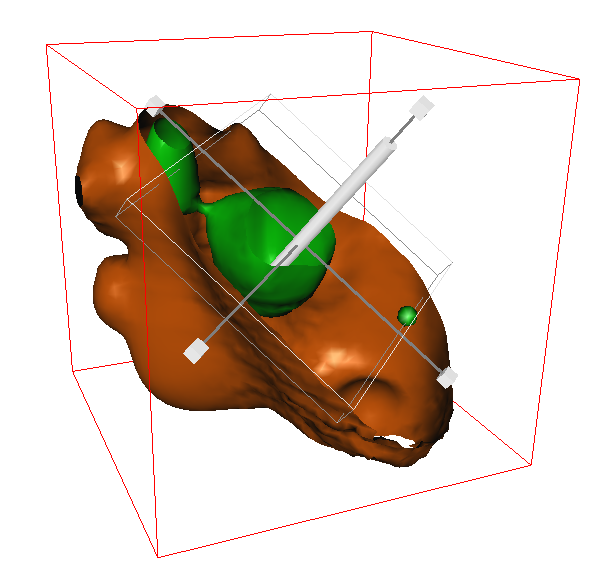
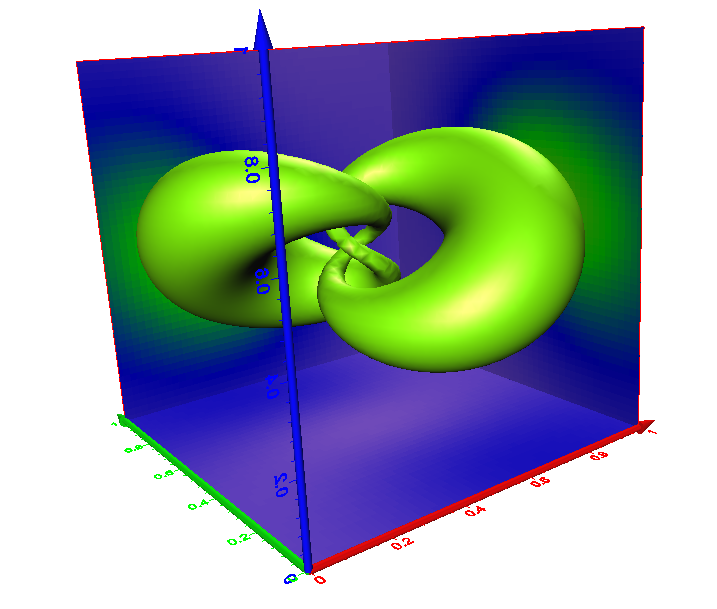
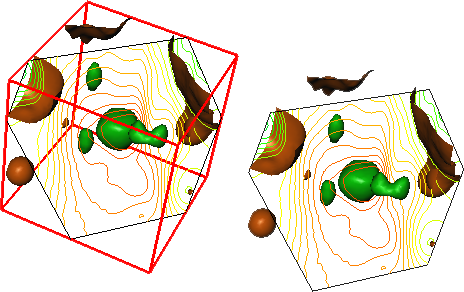
Voxler Features


Voxler Isosurfaces


A Voxler isosurface extends the concept of the contour line (a line of constant data value in two dimensions) to display a surface of constant data value in three dimensions. Combine multiple Isosurfaces color-coded by data value to show discrete values through a 3D grid.

iso
Isosurfaces display surfaces of constant data value.
Specify the color and transparency for each surface
to indicate its value.


Voxler Rendered Volumes

Volume rendering is a 3D display of data that simulates the transmission and absorption of light through the points in the volume. Using Voxler's VolRender module, a rendered volume assigns a color and transparency value to every element in the 3D grid. The VolRender is particularly good at displaying chemical concentration values, contamination plumes, and other types of geophysical data in full 3D.

volumes
A rendered volume displays a color for every element in the 3D grid.
Add transparency to those elements in the grid that you don't want rendered.
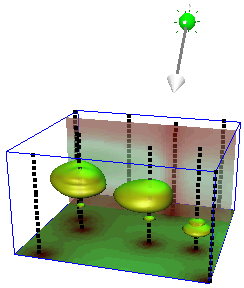

Voxler Contours

Contours display lines of constant data value along a plane. For a Surfer grid, the contours can be draped over the 3D surface. Voxler's contours can be orientated in any direction though a 3D volume and allow for full control of the contour levels, the line widths, and the color mapping.

contours
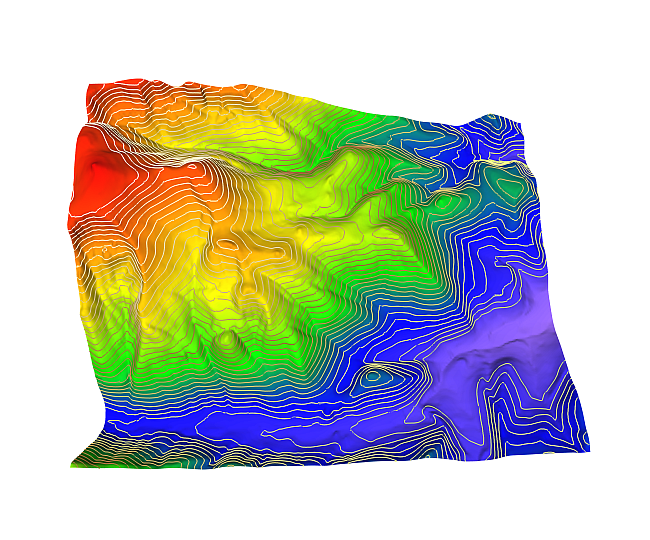
Elevation contours draped over Heightfield that was generated from a Surfer grid file.
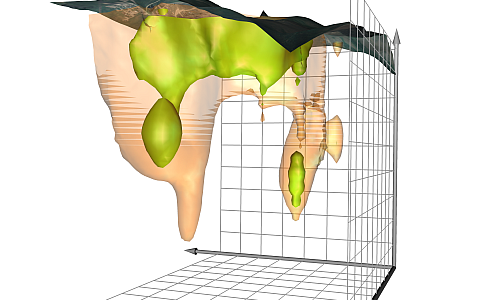

Height Fields

A Heightfield displays data values as colors for a 2D grid, a 2D orthogonal slice of a uniform 3D grid, or along a 2D curvilinear lattice. The data magnitude is also depicted by the amount of displacement above or below the slice. The displacement is perpendicular to the plane or curvilinear lattice and is adjusted by the scale factor. Voxler allows imagery to be overlaid on Heightfields. Heightfields can also be displayed as points and lines.

height
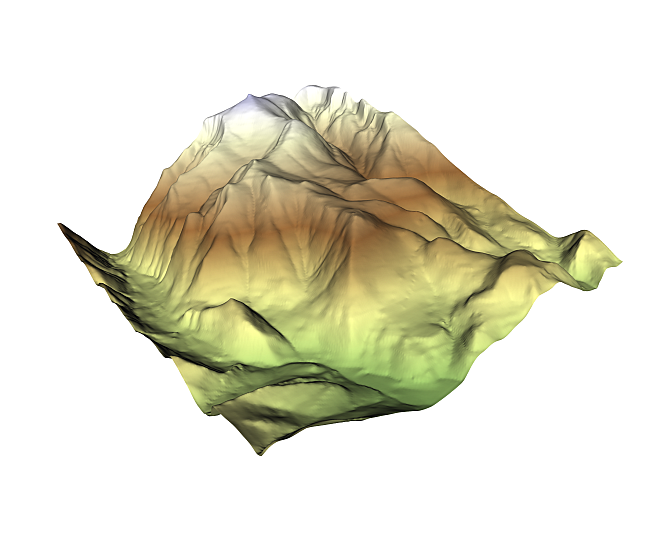
This HeightField, which is generated from a Surfer grid file, displays elevation.


Stream Lines

Stream lines are used to display the path of particles through a velocity field, the distribution of velocities of a medium in 3D space. Different colors indicate the magnitude of the velocities. The technique injects massless particles at specified seed points and traces their paths through the field. The particles stop when the new velocity is zero, the maximum stream length is exceeded, or when the stream intersects the bounds of the field.

Stream lines display the path of particles through a velocity field, the distribution of velocities of a medium in 3D space.
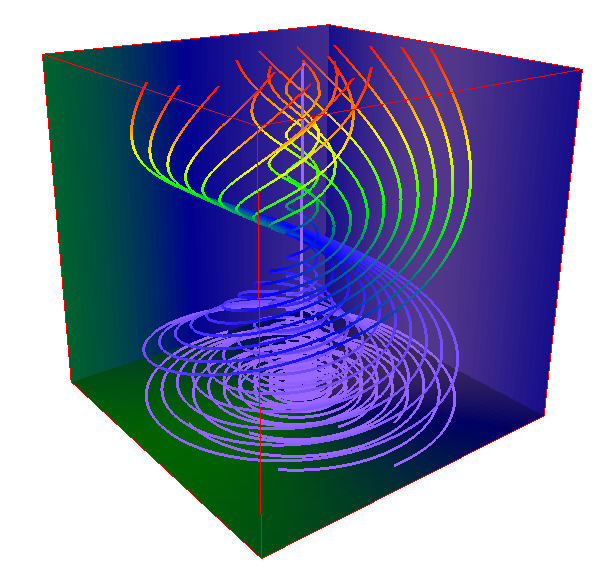
Stream lines indicate particle paths through a vortex.
Colors show the relative velocities of the particles, with
purple being slower and red being faster.


Vector Plots

A vector plot displays lines or arrows indicating the direction and magnitude indicated by the components of a 3D grid or point data set. The magnitude of the vectors is shown by length and color.

A vector plot displays lines or arrows indicating the direction and magnitude indicated by the components of a 3D grid or point data set.
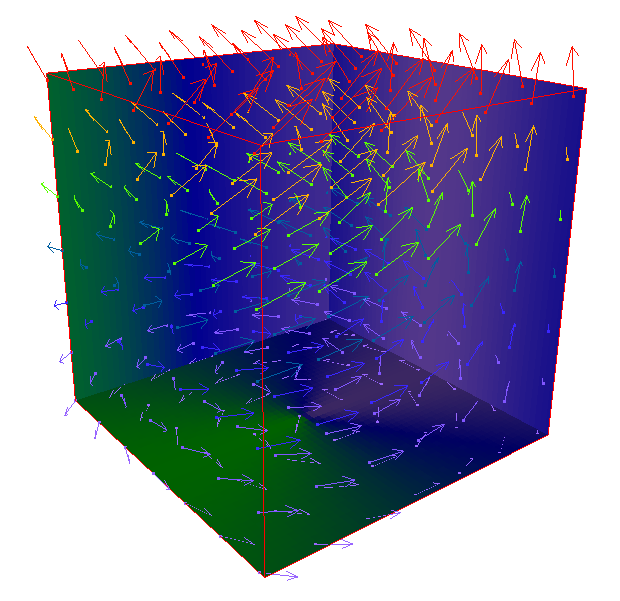
Vector arrows indicate direction and magnitude of the three components
parallel to the X, Y, and Z axes in a 3D grid. Magnitude is also shown by
color with red being higher magnitude and purple showing lower magnitude.
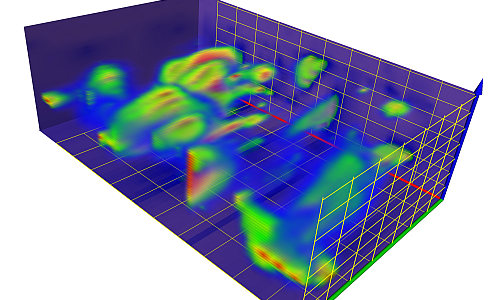
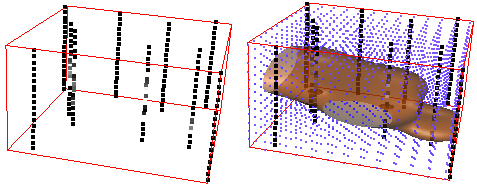

Scatter Plots

A scatter plot displays symbols at the XYZ location specified in the data file. If the data file has a value at each data point, specify different colors for different data values. Voxler offers several symbol choices to customize the plot.

scatter
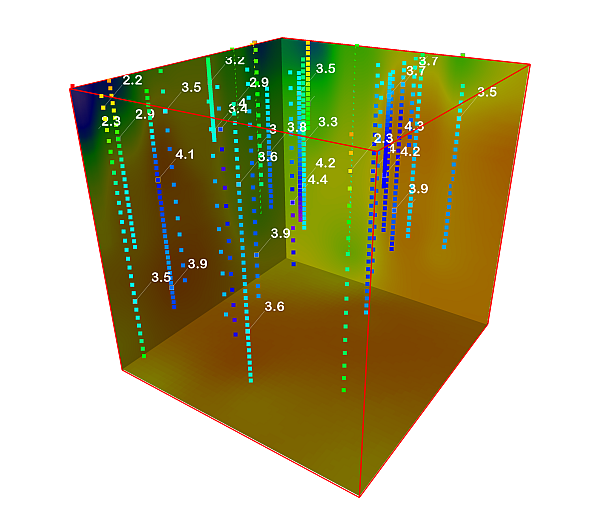
A scatter plot displays symbols for the data sampled in boreholes. Different colors indicate different levels of concentration at each XYZ location.

Voxler Features

Ortho and Oblique images

Orthographic images and oblique images display slices of data. Ortho images can also be used to display georeferenced image files at the correct map location. Oblique images display the image at any 3D direction.

ortho
This example shows a georeferenced TIF file as an ortho image draped over a 3D HeightField.

Voxler Clip Planes


Add a clip plane to any graphic to remove the portion on one side of the clip plane. Add multiple clip planes at different angles to display the area of interest without obstruction.

Clip planes remove a portion of a graphic to display the sections 
Clip planes remove a portion of a graphic to display the sections hidden by the intervening parts of the object.
Here, two clip planes allow the display of an irregularly shaped region.


Axes

Add axes to a plot to display the XYZ coordinate ranges. Axes are color-coded to identify each direction. Change the plane of the axis labels the axis and rotate the labels around a point centered at each tick mark.

Add axes to a plot to display the XYZ coordinate ranges.
Display axes on a plot to show the X, Y, and Z ranges.
Change the axis colors and text angles to differentiate each direction.


Bounding Box

The bounding box is a part of a plot that shows the limits of the XYZ data ranges. It is a good way to show the ranges when the settings produce a graphic that does not cover the entire range, as for some isosurfaces. It also provides a good reference system to orient the graphic output.

A bounding box is a part of a plot that shows the limits of the XYZ data ranges.

The isosurface on the left is difficult to interpret without any reference points.
The same isosurface on the right makes a lot more sense
with the addition of a bounding box.


3D Gridding

Voxler can take scattered XYZC data (XYZ coordinates with a data value C) and produce a uniform 3D grid using Inverse Distance, and Local Polynomial gridding methods. It also can calculate a large number of Data Metrics within the specified search radii, including minimum, maximum, median, mean, quartiles, standard deviation, variance, count, density, and distance to nearest and farthest point.

Voxler can take scattered XYZC data (XYZ coordinates with a data value C) and produce a uniform 3D grid using Inverse Distance, and Local Polynomial gridding methods.

Voxler takes XYZC data (black) and calculates a uniform 3D grid (purple)
to use for displaying isosurfaces, rendered volumes, and other graphics.


More Computational Operations with Voxler

Voxler provides a number of computational options including filters for eliminating duplicate data points, removing data points based on the X, Y, Z, or data values, calculating normal, distance-weighted, Gaussian averaging, data metrics, and image processing. Other computational modules calculate gradient, grid math with up to three 3D grid files, merge up to five 3D grid files, resample, subset, and transform operations.

Voxler offers lighting options for your 3D visualization.

Voxler's computational modules shown from the Network | Computational command.


Adding Light to a Scene with Voxler

Lighting options include ambient light, camera headlight, directional, point, and spot lights with settings for color, intensity and direction. Use the graphical Dragger tool to aim and position directional, point, and spot lights.

Voxler offers lighting options for your 3D visualization.
Use the Dragger tool (shown in the upper portion of the illustration)
to graphically position and angle a directional green light on the scene.


Printing with Voxler

Voxler features an improved print dialog with a print preview that is especially helpful when printing graphics that cover several pages. Don’t guess at how many pages a large plot will need! View the page requirements in the dialog preview. Print everything, or just the current view. Control image quality, add antialiasing to smooth a print out, and print the background color as needed.

Voxler allows you to preview the page breaks for your 3D visualization.
Control your printed output with precision and ease.
Preview the look of a large plot that spans several pages
before you send the print job to the printer.

Network Manager

The Voxler Network window graphically displays the modules (input data, computational, graphic output, info) and their connections. “LED” lights display green, yellow, or red to indicate the status of the module. Click on a module to select it and to display its settings in the Properties window.

network
The Network window presents a graphical display of 
the input data, computational, graphic output, and
info modules and the connections between the modules.


Propertiy Manager

The Property Manager lists the settings for the selected module with edit boxes, sliders, and buttons for changing the settings.

property
The Property Manager displays a list of the settings
for the selected module. Edit boxes, sliders, and buttons
provide the methods for changing the settings.


Supported File Formats
formats<


Automation

Create your own scripts to automate repetitive tasks. You do not need to spend time doing the same process over and over again – write a simple script to simplify your workflow. Operations performed interactively can be controlled using an automation-compatible programming language such as Visual Basic, C++, or Perl. Voxler 3 includes Scripter™, a built-in Visual Basic compatible programming environment that lets you write, edit, debug, and run scripts. Why do more work than you need when you have Voxler working for you?

Voxler 3 data folder includes many sample scripts to help you get started. website.
automation

Capture Video

Voxler 3 adds a video record procedure so you can save animation to an AVI file. You can make changes to your maps and images, and have them recorded in the AVI to share with other users. Video settings allow you to control the quality and file size of the output AVI file.Video settings allow you to control the quality and file size of the output AVI file.