The WINKS Professional Edition includes all of the features of the WINKS BASIC EDITION plus...
- Grubbs test for outliers & Tukey's outlier test
- Advanced Tabulation allows breakdown of tables by three factors with various statistics included in each cell.
- The Mantel-Haenszel procedure allows analysis of multiway tables (useful in meta-analysis, when you want to pool information from several 2x2 tables or for the analysis of two dichotomous variables while adjusting for third.)
- Inter/Rater Reliability & Kappa allows analysis of reliability data that includes both Kappa and Weight Kappa analyses including confidence intervals
- Two Factor Analysis of Variance can handle unbalanced data and includes graphs and post hoc multiple comparisons
- Two-way ANOVA with Repeated Measures includes graphs and post hoc tests.
- Analysis of Covariance (ANCOVA) includes graphs and post hoc tests
- Three-Way ANOVA
- Polynomial Regression up to 6th order sextic regression with graphs
- Stepwise regression for multiple linear regression modeling
- All possible subsets regression finds best models for multiple linear regression
- Simple Logistic Regression for simple logistic modeling with a binary or continuous independent variable, including calculating predictions from model and includes odds ratio with 95% confidence intervals
- Multiple Logistic Regression -- allows you to fit up to 10 independent variables in a logistic model, includes calculation of parameters and odds rations with 95% confidence intervals.
- Bland-Altman plots for comparison of two similar measures, includes a plot of equality as well as the Bland-Altman plot
- Multiple comparisons (Newman-Keuls, Tukey HSD, or Scheffé), calculate custom post hoc multiple comparisons that include a graphical summary of results
- Time series analysis including data plotting, autocorrelations, partial autocorrelations, estimating parameters, differencing and forecasting. The program allows you to estimate the parameters of an ARMA model and create a forecast using your model (using three forecasting techniques). The forecast can then be displayed and captured as numbers in a file.
- Quality Control charts and procedures allows you to create X-Bar Charts, R-Charts, S-Charts, EWMA, MR-Charts, I-Charts and P-Charts. It will automatically calculate 3-sigma limits, or you can specify your own limits. Data replicates can be balanced or unbalanced. X-Bar Charts can be displayed on the same screen with an R-Chart or an S-Chart.
- The Pareto Chart procedure allows you to display Pareto charts, which are used to determine priorities for quality improvement. The by-group feature allows you to display charts by a grouping factor (i.e., day of week, operator.)
Following are sample graphs from WINKS Professional SDA:
(Interaction plot from Two-Way ANOVA)
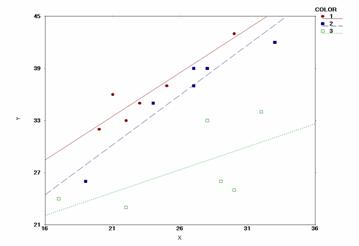
Example ANCOVA Plot
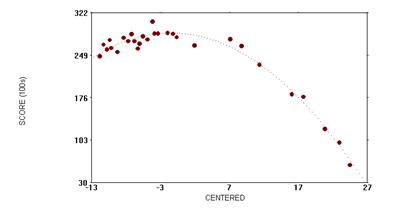
Polynomial regression plot
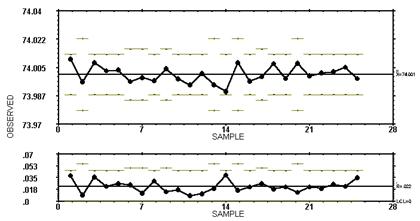
Quality Control Plot
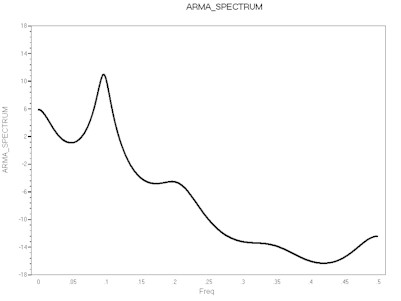
Time series spectrum plot
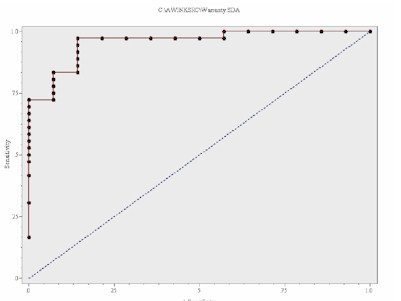
ROC Curve Logistic Regression
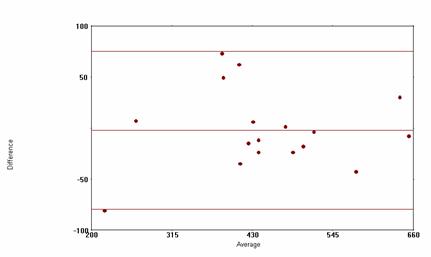
Bland Altman Plot
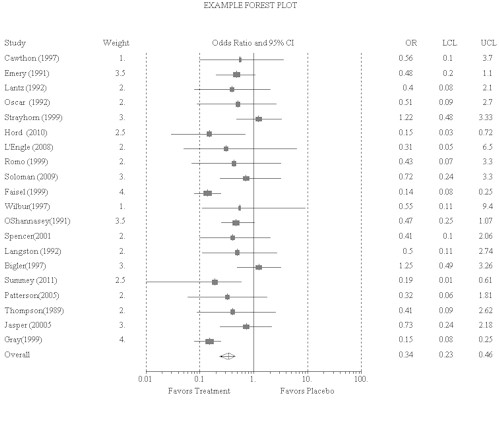
Forest Plot (Meta-Analysis)
Some procedures in WINKS SDA Professional require Windows XP or higher.