


- Introduzione
- Caratteristiche
- Grafici
- Requisiti di sistema
Communicate your discoveries in a clear and convincing way
Your data, your results, your researches do not have much value if you don't share them. It doesn't matter if it's about an article on a professional magazine, a powerpoint presentation or your task for a job session, Kaleidagraph gives you all the tools you need to communicate in a clear and convincing way.
KaleidaGraph contains the comprehensive toolset you need to get your graphing and data analysis done quickly and easily. Period. No costly "bells and whistles" that you rarely use. No complicated software that costs you valuable time and takes you away from your science. Just exceptional, accurate graphing and analysis at a remarkable price.
VISUALIZE YOUR DATA
Flexible Data Entry
Begin your analysis by either opening a data file or entering data using the keyboard. Excel files may be opened directly. Tab, space, and other delimited text files use a very flexible import facility.
Fast and Versatile Graphing Choices
Create plots quickly and easily using entire data columns or just a selection of your data. Data can be spread across multiple files and seamlessly integrated into one powerful graph to best explain your work. Plot types include: Line, Scatter (X-Y), Double-X, Double-Y, Histogram, Box, Percentile, Horizontal Bar, Stack Bar, Column, Stack Column, Polar, Pie, Summary Column, Double Y Bar, Double Y Column, Dot and Function (enter a formula).
Complete Control over Every Plot Option
To customize every detail of your plot, simply click directly on each plot element, and a make the logical choices to best illustrate your data. You can modify the axis limits, text labels, tick marks, legend, line thickness, marker shapes & sizes, and more.
Templates
When you create a graph you like, save it as a template so you can use it with repetitive data sets for a consistent presentation.
ANALIZE YOUR FINDINGS
Powerful Data Analysis and Manipulation
Easy-to-use commands for analyzing your data include a variety of basic statistics, Student t-test, ANOVA, and Wilcoxon. Use the Formula entry window to manipulate your data using over 100 algebraic equations and statistical functions from convenient menus.
Error Bars
Add error bars to your plot where the error can be specified in a data column or can be calculated by KaleidaGraph.
Precise Curve Fitting
Apply a variety of curve fits to your plot. We supply 9 generic fits, including Least Squares (Linear) Regression and Smoothing fits, plus a library of over 100 industry-specific formulas. Utilize one of these predefined fits or enter your own equation for your data. All fits are calculated with incredible speed and accuracy.
COMMUNICATE YOUR RESULTS
Effortless Printing and Plot Export.
Use KaleidaGraph's page layout window to create multigraph presentations. Choose simple features that rearrange and resize your graphs. Then add text, colored backgrounds, and graphics as needed to achieve a professional result. Easily export graphs to PowerPoint, the web, or a favorite application using popular file formats.
Powerful Curve Fitting
- Built-in fits include: Smooth Weighted, Cubic Spline, and Interpolate curve fits, as well as Least Squares Regressions (linear, polynomial, exponential, logarithmic and power).
- Includes a library of over 100 industry-specific formulas you can customize.
- Utilize a predefined fit or enter your own equation (up to 9 parameters)
- Define up to 16 curve fits for simultanoues use on a single plot.
- Extrapolate curve fits to axis limits.
- Show fit equation, parameters, and R or R2.
- Copy the values of the curve fit or the residuals into the data window for further analysis.
Data Entry
- Type data directly into the data window.
- Open Excel files directly.
- Import Tab, Space, and Comma delimited text files created in other applications.
- Read user specified data formats, including fixed / variable data widths and read / skip capabilitiy.
- Preview your data set while importing it.
- Windows and Macintosh data and graphs are fully interchangeable. DDE client support (Windows version).
Plot Types
- Line, Scatter (X-Y), Double-X, Double-Y, Double-XY, High/Low, Step, Probability, X-Y Probability, Histogram, Box, Percentile, Horizontal Bar, Stack Bar, Column, Stack Column, Polar, Pie Summary Column, Double Y Bar, Double Y Column, Dot and Function (enter a formula).
- Binned data can be exported to a Histtogram, Step Plot, or Spike Plot.
Plot Customization
- Fully customize your plot's attributes (axis limits, label frequency, ticks, grids, color, font, style, legend, plot size, etc.)
- Create customized color palettes.
- Control the number of markers displayed, marker shape (36 choices), size, and color.
- Control the ticks and axis labels on the X2 and Y2 axes by creating a link to their primary axis.
- Set the initial tick mark and specify tick intervals.
- Log or Linear axis settings.
- Partial decades allowed on any log axis.
- Option to use standard baseline instead of 1 on column plots with a log axis.Display rulers and grids for placing plot elements.Preview your plot changes without leaving the dialog.
- Add very flexible axis breaks.
- Cross axis at a specific value.
- Freely position the plot axis at any desired location.
- Display scientific and engineering plot labels in one of five formats.
Drawing Tools
- Add Lines, Arrows, Boxes, Ovals, Arcs, Polygons, and Bezier curves to the plot.
- Choose from 11 different styles for lines and arrows.
- Copy, Duplicate, Group, Align, and Layer objects.
Data Management
- Up to 160 open data windows (containing up to 1000 columns by 1 million rows each).
- Data Formats: Floating point, Double precision, Integer, Data, Time, and Text.
- Display date and time values in one of 18 formats.
- Perform multi-level sorts on the data.
- Make notes about your data (Posted Note).
- Update the plot automatically (or on-demand) if any changes are made in the data window.
- Independently adjustable column width and row height.
- Select font, font size, style, justification, font color and background color for individual columns.
- Add horizontal and vertical splits to compare different sections of the same data window.
- Perform key operations quickly using the Toolbar.
Data Analysis & Manipulation
- Statistics
- Parametric Tests: One and two way ANOVA (with repeated measures), t-test.
- Nonparametric Tests: Wilcoxon (Signed Rank, Matched Pairs, Wilcoxon-Mann-Whitney), Kruskal-Wallis, and Friedman.
- Post Hoc Tests: Tukey HSD, Bonferonni, Holm, Student-Newman-Keuls, Scheffe, Fisher's LSD and Dunnett.
- Descriptive Statistics: Min, Max, Sum, Points, Mean, Median, RMS, Std Deviation, Variance, Std Error, Skewness, and Kurtosis
- Formula entry
- Select from over 100 menu items to create algebraic equations for data manipulations.
- Use scripts to automate the process of importing data, manipulating data, creating plots, and exporting or printing plots.
- Macro Calculator
- Use Conditional testing, Boolean testing, Subroutines, and Nested Loops.
- 1000 step RPN program capability.
Special Plot Features
- User selectable error bars can be added with independent upper and lowe error types. Error values can be calculated or specified in a data column.
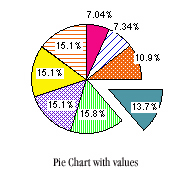
- Graphically mask data regions to temporarily eliminate data point. Numerical values of bars, columns, or pie slices can be placed automatically on the plot.
- Plot up to 20 dependent variables at once on a single set of axes. Combine multiple data sets on a single plot.
- Plot multiple X variables from one data set.
- Use the Extract button to display any data windows used to create the plot.
Export / Import & Print
- Export plots as Metafile, JPG, GIF, TIFF, PICT, PNG, and BMP files. EPS also utilizing printer driver.
- Import Metafile, JPG, GIF, TIFF, PICT, BMP, and EPS files.
- Use the page layout feature to easily combine plots, text, and graphics on a single page.
- OLE Server support (Windows version).
- Save plots and layout in a single file.
- Seamless interaction with Microsoft Office including ungrouping of plots in PowerPoint.
Kaleidagraph Plot Samples Linear / Scatter
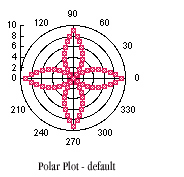
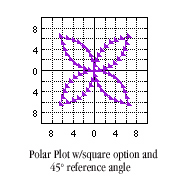
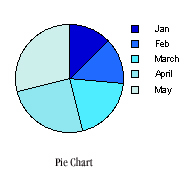
Polar and Pie
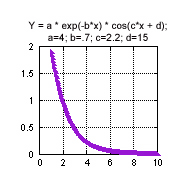
Function
|
Kaleidagraph System Requirements
WINDOWS
- Intel Pentium Processor
- Windows XP SP2, Vista, 7 and newer
- 256 MB RAM
- 45 MB available disk space
MACINTOSH
- PowerPC or Intel processor
- Mac OSX 10.3.9 and later
- 256 MB RAM
- 45 MB available disk space
 |

 +39 0131.250.313
 info@net-eng.it